Sunday, September 23, 2012

How Long Will The Syrian Civil War Last?


I didn’t expect the bombing of U.S. embassies in North Africa and the Middle East when I began to research this post, but the current state of affairs in that region- unfortunately- fits very well this topic.

It’s been nearly two years now since the start of the Arab Spring. Since then, we’ve seen many changes in North Africa and the Middle East. As the protests grew, they captured international attention. First, Tunisia’s government toppled. Sparked by their success, perhaps, other protests broke out across the region. Egyptians overthrew their own government less than a month later, and then Yemen followed shortly afterwards. In Libya, a civil war broke out, and the rebel forces were successful by the end of August. Many countries have had governmental changes; many others are still seeing ongoing protests.

The bombing in Libya, and subsequent anti-U.S. attacks and protests, prove that the Middle East and North Africa aren’t as stable as we’d hoped they’d be. We should have expected this, though. After facing civil wars and major governmental changes, it would be surprising if a country wasn’t in turmoil. And turmoil is exactly what we have. It’s sadly commonplace for a country to fall back into a state of civil war and disorganization directly following a revolution.

How long will it take for things to stabilize in the region? That’s tough to answer. It’s not like a civil war, which can end overnight. We won’t wake up one morning to find that everything’s better. It will be a long, slow process that will likely take years to finish.

Let’s turn our attention towards the bloodiest state right now, the one still in the midst of a gruesome civil war: Syria. This war has been ongoing for far longer than any of the other armed conflicts associated with the Arab Spring, and shows no signs of stopping. How long will it be until the war ends, and how will it end? That’s the question we attempt to answer today.
 _________________________________________________________________________________________________

I compiled data on 45 different civil wars besides the Syrian war. 43 took place since 1930 (20 since the year 2000- in green), and the other two were the United States Civil and Revolutionary War, which will be used only as standards for comparison. 9 wars took place in the Middle East (in tan on the data table), 22 in Africa (yellow), and the rest took place elsewhere in the world, mainly East Asia and Central and South America. 37 lasted longer than a year (in blue). 

I found data for each war on the death toll, the total population of the country (at the midpoint of the war), the percentage of the population killed, and whether or not the group that was rebelling was successful.

Below is a scatter plot of the death toll of each war vs. when it started. Ongoing (most at low-level) wars are in red in each scatter plot:


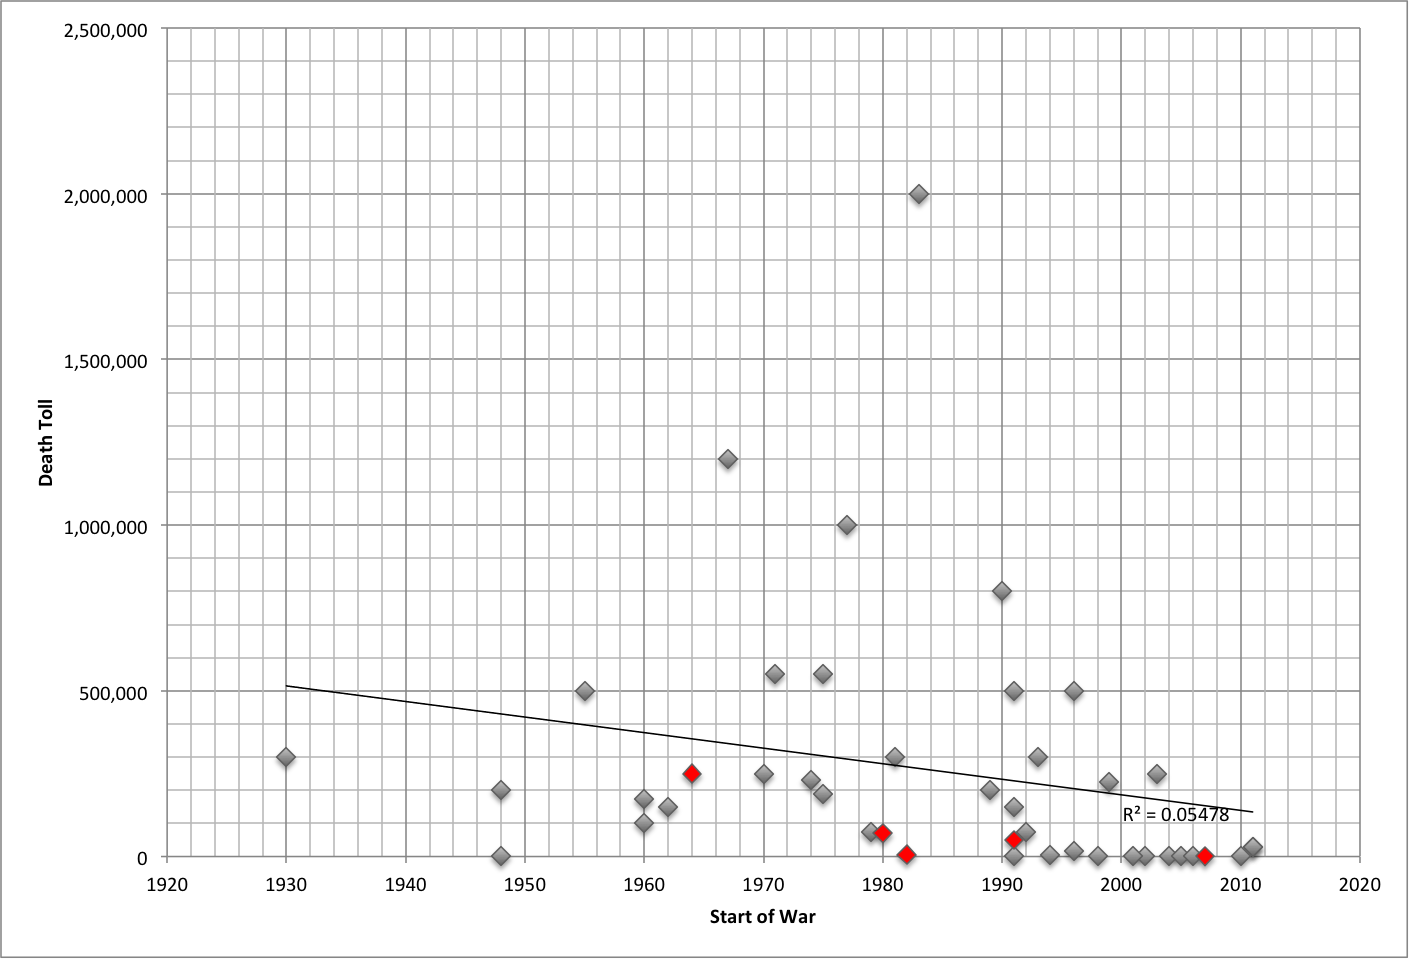
There’s no correlation between when a war began and its total death toll. This means that we haven’t been killing more people with new, advanced weaponry, but it also means the number of people dying in these wars is going down.

Additionally, one of the more disturbing trends we’ve seen recently regards the number of civilians killed in times of war. It’s very difficult to find statistics on this matter, especially since most civil wars take place in under-developed countries. However, in many civil wars, a vast majority of the people killed aren’t the soldiers and combatants on either side- they’re innocent civilians, killed by bombs or other atrocities. From the limited data I found on this, I’d estimate maybe 90% of people killed in the average civil war for the past thirty or so years were civilians.

The next chart is a plot of the percentage of the population killed vs. the starting year of the war:

 
Again, there’s no correlation between the two.

Finally, here’s a chart of the results of each civil war. Five are ongoing (four at a low-level), and two are listed as “N/A” because those wars were a result of a power struggle shortly after a revolution:


Most rebels are actually very successful in civil wars. About 1/3 of the civil wars I looked at ended with rebel victories. Another 13 ended in tentative peace agreements, which usually grants some demands of the rebels. Only seven of the 43 wars I analyzed ended with rebel defeats.

Why is this? Simple: The rebels are fighting for much more than the incumbent government. They want change, and will go to greater lengths to get that change. We can see a smaller version of this right here in America with- believe it or not- online and telephone surveys. The results of those polls are often skewed towards change because the people that want change are feel strongest about the issue are more likely to respond to the survey.

All things considered, the average death toll for the civil wars I examined was 266,940, and the average percentage of the population killed was 2.37%. 

In the Middle East alone, the percentage of population killed was very similar: 2.38%.  Taking into account African countries yields a higher percentage: 2.71%. For Syria, this percentage means 535,000-610,000 people would die in the fighting- twenty times the current amount. The 267,000 figure is much more plausible.

The length of the conflict is difficult to predict. The average length from the data was 9.79 years; not counting ongoing conflicts, it was 7.74 years. The figure for the Middle East alone was 7.87 years.  The first number actually makes sense; at the current rate, the death toll would reach 267,000 in a little under nine years.

Let’s compare this to the U.S. Civil and Revolutionary Wars. The Civil War lasted just over four years, yet took the lives of 625,000 people, the vast majority of them soldiers. The Revolutionary War, on the other hand, lasted over eight years- yet only 50,000 Americans were killed, with about 35,000 Europeans. Warfare has certainly changed over the years- and not necessarily for the better. The change from conventional battlegrounds has led to the deaths of many innocent people.

Now, to conclude. Based on the data, I expect the civil war in Syria will last about six or seven more years, and will cause the death of a little over 200,000 more people- most of them civilians. I sincerely hope that this prediction is wrong and the war ends quickly- but that’s not what the statistics suggest will happen. History does say, however, that the Syrian rebels stand a good chance of winning.

Friday, September 7, 2012

When Will The Next Big Hurricane Hit The U.S.?


I remember the coverage of Hurricane Katrina very clearly. I woke up and immediately went to watch the news, and Katrina was just coming in. We knew it would cause a lot of damage, but I don’t think anyone knew that it would cause quite as much as it did. In the weeks afterward, the costliest natural disaster in American history dominated the headlines.

I have a special reminder of Katrina every year: The hurricane made landfall in New Orleans on my birthday. This connection makes me think of the power of hurricanes annually- and they always fascinate me.

We like to think that we’re above the power of nature. We’ve climbed to the top of the world, and explored the depths of the sea. We’ve built buildings that are ridiculously high- it’s almost like we’re mocking nature, pretending to be invulnerable. And then, something like Katrina happens, be it a hurricane, earthquake, tsunami, anything; and it sends us crashing- sometimes literally- back to earth.

This year, I had another reason to think of hurricanes. On my birthday this year, another hurricane- Hurricane Isaac- made landfall in New Orleans. Thankfully, the damage caused by Isaac was nowhere close to the damage caused by Katrina; however, it was a reminder: at any time, there could be another hurricane just as strong as Katrina. So is there a way to predict when the next “big one” will hit?
____________________________________________________________________________________________________
The attribute that makes natural disasters so powerful is their unpredictability. Volcanoes may give a few weeks’ at max. Hurricanes form and make landfall within a couple of days. We’ve vastly improved our tornado warning system; now we have nearly fifteen minutes of notice! And earthquakes- well, good luck. The 2005 hurricane season was especially unpredictable- we’ll get to that in a little bit. But the variability of hurricanes is what makes predicting the next powerful one especially difficult.

I could use all Atlantic hurricanes as my data set for this project, but I have neither the time nor the patience for that. Instead, I’m looking at only hurricanes who have been powerful enough to have their names retired:

There have been 77 retired names since 1954. One, Gracie (1959), is listed as retired by some sources but not others. Another, Allison (2001), was retired despite never actually becoming a hurricane.


There are a lot of extremely strong hurricanes in this set, but there’s still a very large number (there’s even a tropical storm!).  I’m going to narrow it down even further, to hurricanes that caused most of their damage to the United States. This eliminates hurricanes like Mitch in 1998, but I’m investigating when the next big hurricane will hit the U.S., not the rest of the Atlantic.


42 storms are represented above. I assigned a score to each hurricane based on each of the statistics on the right (scores not shown); Katrina (2005) was easily the most extreme hurricane ever to hit the United States.


Now we can begin looking for trends. Hurricanes overall appear to be getting stronger and it looks like there are more that have been retired in recent years, but…

R2 =0.07818


That’s not a very conclusive regression line, and logarithmic or exponential lines don’t really fit either. While the numbers from 2003-2005 are eye-catching (12 hurricane names retired in three years!), 2006 and 2009 did not have any hurricanes retired, and neither hurricane on that graph from 2010 made landfall in the U.S..

On the other hand, there has been a small increase in total named storms over the years:

http://upload.wikimedia.org/wikipedia/en/timeline/61b5be0856ccb449ab4978b2909ae8d7.png


There might be a bit of a cycle going on- in recent years, a two to four year cycle of powerful hurricane seasons appears. 2008 had several strong hurricanes three years after 2005, and 2009 had none after the weak 2006 season. But as we look back (and forward- just Irene in 2011), we can see that this theory doesn’t hold.

How about ENSO? We covered this phenomenon in depth a few months back, and it would make sense. El Nino supposedly represses hurricane growth, and our data supports that. Unusually strong El Nino effects match up with unusually weak hurricane season.  The reverse of El Nino, La Nina, would then spur hurricane growth, right? Not so fast- the data on hurricane seasons that correspond with La Nina doesn’t provide a strong correlation either way.

The key to this problem would appear to be the 2005 hurricane season. It was unusual in many ways. By all measures, it was the strongest hurricane season ever. Hurricane Emily was the earliest category 5 storm ever. Vince formed father northeast (into cooler waters) than any other storm on record. Wilma strengthened ridiculously fast after its formation. Hurricane Epsilon was the latest hurricanes ever, lasting deep into December. Tropical Storm Zeta went all the way into January. And yes; those are Greek letters, meaning that the 21 letters from the English alphabet were exhausted- the only time this has ever happened. In all, the 2005 season produced 31 tropical depressions, 27 named storms, and 15 hurricanes (7 of category 3 or above). It accounted for 3,913 deaths and over $150 billion of damage.

I can find just two unusual aspects concerning the climate in 2005. The first is that El Nino was expected to develop, but didn’t. The second is that the years leading up to it- 2002-2005- were four of the five warmest years on record (at the time). Fourteen hurricane names were retired for these four years, and the one other year in the top five was 1998, which saw the wraths of Hurricanes Mitch and Georges. Did the heat finally reach a climax in 2005, causing the extreme hurricane season? Maybe, but more likely not. In the Pacific, 2005 was an average or below average year. (It should be noted that 2006 was the most active Pacific season since 2000, however.) Additionally, many of the years since 2005 have been warmer, and yet none of them had hurricane seasons quite as strong.

Overall, I just can’t find a trend for powerful storm season. Hurricanes are simply so unpredictable that a storm season predicted to be “slightly above-average” can produce 28 named storms; the opposite can be true as well. We don’t know when, specifically, in a season the next big hurricane will hit, or even what year it will be.* We can make guesses, but nature will laugh at us and prove us wrong anyway. The best we can do is prepare for the worst and try to minimize the damage and loss of life.

*In 2011, Colorado State University, one of the leading hurricane prediction centers, announced that it would no longer be releasing quantitative forecasts six months prior to each season, as  "...forecasts of the last 20 years have not shown real-time forecast skill." Hurricanes are unpredictable even for the professionals from a long distance away.