Showing posts with label Science. Show all posts

Friday, October 26, 2012

Can We Find A Trend In The Fungal Meningitis Outbreak?


Epidemiologists have some of the most intriguing jobs in the world. No other branch of science can make an immediate impact akin to that of the study of diseases. The fruit of diligent research can be life- no, world-changing. And when an epidemic strikes, their fast actions can save thousands of lives.

Kudos to the epidemiologists on the case of the recent outbreak of fungal meningitis. I heard about the outbreak, and then one day later they had already located the cause and were doing work to minimize the damage done by the tainted steroids. Unfortunately, they can’t save every life, and nearly 300 cases have been reported with a fatality rate of about 8%. However, their quick work surely saved many more lives.

For my latest post, I’ve decided to play epidemiologist to try an isolate a trend among the data for the meningitis outbreak. Is there a reason that certain states have been hit harder than others? (Besides, of course, the states that haven’t received the infected drugs, and obvious comparisons like population)

_______________________________________________________________________________________________

The CDC website doesn’t have information on former outbreaks of fungal meningitis (or if they do, they’re hiding it very well), and this made my first idea- does this outbreak parallel previous outbreaks?- very short-lived. However, the CDC did have interesting statistics on another topic, which redirected my plan for this post.

The fungal meningitis outbreak has apparently been classified as a “Healthcare-Associated Infection” or “HAI”. The CDC tracks HAIs in a variety of ways; one of them is an SIR value: Standardized Infection Ratio. This value is found by taking the number of actual HAIs and dividing it by a predicted number of HAIs. Lower numbers are better, and values under 0.5 are very good. Similarly, values over 1.0 are very bad- this means that the included facilities are actually causing more infections than they’re projected to.

Here is a chart of the SIR values (in 2010, the most recent I could find) for all of the states where the tainted steroids have been sent:


 These values are mostly good; Indiana is the only state with a value above 1, and Michigan and West Virginia both have values under 0.5 (Remember that!)

You may have noticed that three states- Idaho, Minnesota, and Rhode Island- don’t have SIR values on the graph. This is because SIR values are independently submitted by health care centers, and some states don’t have enough centers submitting information to the CDC for effective calculation of SIR. These three states are some examples- less than five centers submitted information over 2010, whereas most states have several dozen.
Since the outbreak is a HAI, it would be reasonable to assume that most of the infections occurred in states with high SIR values. But that isn’t the case:

STATE
CASES
ILLINOIS
1
NEW YORK
1
IDAHO
1
PENNSYLVANIA
1
TEXAS
1
NORTH CAROLINA
2
MINNESOTA
7
FLORIDA
17
MARYLAND
16
NEW JERSEY
16
OHIO
11
NEW HAMPSHIRE
10
INDIANA
38
MICHIGAN
53
VIRGINIA
41
TENNESSEE
69
CALIFORNIA
0
CONNECTICUT
0
GEORGIA
0
NEVADA
0
RHODE ISLAND
0
SOUTH CAROLINA
0
WEST VIRGINIA
0
TOTAL
285

Indiana, which had the highest SIR value, has quite a few cases compared to other states. Michigan, however, had the lowest SIR value- and has more cases than any state except Tennessee. But West Virginia, which had the second-lowest SIR value, has zero cases.

Why is there variability in the data? One reason is because not every state received the same amount of the infected drug. Only one facility in West Virginia received the drug, compared to six in Indiana. Based on the data, each facility that received a shipment of the steroid had about 3.8 infections. From this average, we can predict how many cases will occur in each state:


This isn’t very good. We can take it our prediction one step further by applying a state’s SIR to the predicted number of cases (for example, Illinois: 11 predicted cases x 0.678= 8 predicted cases with SIR):

 
There’s still no strong correlation here between SIR and the number of cases. We can calculate our own SIR values for these states using our predicted number of cases and the number of actual cases. Unfortunately, when we do this, only four states- the ones in blue on the data table and the following graph- have SIR values that fall within the standard range of scores (that is, the range of scores for all 50 states.):

M-SIR represents my own calculated SIR value based solely on the meningitis statistics


Quite simply, there’s no correlation between HAI SIR values and the recent fungal meningitis outbreak. The only explanation I can come up with for this is that most facilities used the tainted steroid believing it to be safe, whereas with most HAIs the healthcare center should know how to avoid the problem.

My data:

Note: All data as of October 21, 2012

Tuesday, October 9, 2012

How Successful Will The iPhone 5 Be?


When it comes to technology- and specifically, new products- perhaps nothing is more anticipated than the iPhone. When the original iPhone was released in 2007, it was the beginning of the Age of the Smartphones. Since then, Apple has stayed on the cutting-edge when it comes to their iPhones, and excitement and anticipation over technological leaps and bounds precede each release.

Last weekend, Apple released their new iPhone, the iPhone 5. Apple had had nearly a year since its most recent phone, the iPhone 4S, to work on improvements. The major selling points Apple hit on in its press release were the physical features, hailing the new product as the “Thinnest, Lightest iPhone Ever”. For this post, I thought I’d take a look at that claim, and examine the evolution of the iPhone. Is it really the thinnest, lightest iPhone ever? Is there anything that prior incarnations of the smartphone did better? Just how much money is Apple making on the iPhone, anyway?

_________________________________________________________________________________________________

Apple has released a new iPhone fairly regularly- about once a year. I won’t be discussing the technological advancements of the iPhone in this post because it’s clear the iPhone has progressed substantially in terms of technology (Siri, anyone? It’s something Sci-Fi authors could only dream about even recently). Instead, we’ll be taking a look at the physical aspects of each phone.

The following graph represents the change in width for the iPhone over time:


As you can see, there’s clearly no change between this generation and the previous two. However, the other dimensions of the iPhone 5- height, depth, and weight- have changed somewhat. Here are those graphs:


The iPhone 5 is significantly larger in terms of height over its previous incarnations. However, the change shouldn’t be terribly noticeable for anyone using the phone: Only about eight millimeters, or a little more than the length of a red ant. It also results in a potential increase in screen size, though again, not terribly noticeable.

The iPhone 5 is also easily the thinnest iPhone yet, with a depth of only 7.6 mm. But is it really that significant of a change? The new phone has only shed 1.7 mm. Remember that ant from earlier? 1.7 mm is about the length of its head, maybe a little smaller. The change probably won’t make any significant difference in the future.

The weight of the new iPhone is something Apple is significantly proud about. They claim to have eliminated 20% of the weight of the iPhone 4S (and they have, actually), but since the iPhone 4S was so light in the first place (140 grams), is it really such a big deal? Let’s examine: the iPhone 5 is 28 grams lighter, so imagine three pencils, or five quarters. I suppose this could make up a fairly noticeable change- I’ve never actually held and compared the two, so I’m just making an estimation. But again, the iPhone 4S was already very light, so Apple isn’t actually saving the backs of millions of their customers (thank you, the Onion).

I also measured some characteristics of the iPhone that aren’t exactly physical: memory and battery life. We can easily see the change in memory over the generations simply by looking at what was sold- the original iPhone was sold in 4, 8, and 16 GB versions, and while every iPhone generation has had a 16 GB version, it’s the smallest memory option for the iPhone 4S and 5, which have 32 GB and 64 GB variants.


Battery life is more interesting than storage memory. Audio and Video battery life has gradually increased over the years (40 hours of audio since the iPhone 4, and 10 hours of video since the iPhone 3G), but standby life has a different trend. The iPhones 3G, 3GS, and 4 all had the most standby life, at 300 hours. The iPhone 5 has three days less life than that. Apple can still claim that it has increased the battery power, however, since the iPhone 4S only had 200 hours of battery life.
 _____________________________________________________________________________________

Has Apple been doing enough to attract new customers and retain their old ones? How have their iPhone sales done over the years? The answer may surprise you:


Black plots in the above graphs represent the first quarter of Apple’s fiscal year. Their first quarter falls over the holiday season, and so yields significantly higher sales and revenue.

The iPhone has been a complete and utter success for Apple. Sales per quarter after the release of each phone have, at the very least, doubled. In the quarter after Apple released the iPhone 3G, it saw an 861% increase in units sold. Yes, you read that number right: 861%. While each iPhone slowly trends downward after release (I estimated a 25% loss each quarter when a newer model was on the market), Apple still pulls in billions of dollars each month, and could hit $100 billion of revenue for this fiscal year.

Even more promising for Apple is the first-weekend sales of its new iPhone 5. Five million phones were sold, bringing in about $1.5 billion- more revenue than the original iPhone made in its entire run, and nearly as many units sold.


Bounds were determined in several ways, but should be viewed as the maximum and minimum possible totals for each phone. We know that no phone has sold $0, so we have to estimate the lower bound. The estimated exact total is based on the 25% decay rate mentioned above and, barring the discovery of the actual data, is a good ballpark figure for each phone’s sales totals.

Friday, September 7, 2012

When Will The Next Big Hurricane Hit The U.S.?


I remember the coverage of Hurricane Katrina very clearly. I woke up and immediately went to watch the news, and Katrina was just coming in. We knew it would cause a lot of damage, but I don’t think anyone knew that it would cause quite as much as it did. In the weeks afterward, the costliest natural disaster in American history dominated the headlines.

I have a special reminder of Katrina every year: The hurricane made landfall in New Orleans on my birthday. This connection makes me think of the power of hurricanes annually- and they always fascinate me.

We like to think that we’re above the power of nature. We’ve climbed to the top of the world, and explored the depths of the sea. We’ve built buildings that are ridiculously high- it’s almost like we’re mocking nature, pretending to be invulnerable. And then, something like Katrina happens, be it a hurricane, earthquake, tsunami, anything; and it sends us crashing- sometimes literally- back to earth.

This year, I had another reason to think of hurricanes. On my birthday this year, another hurricane- Hurricane Isaac- made landfall in New Orleans. Thankfully, the damage caused by Isaac was nowhere close to the damage caused by Katrina; however, it was a reminder: at any time, there could be another hurricane just as strong as Katrina. So is there a way to predict when the next “big one” will hit?
____________________________________________________________________________________________________
The attribute that makes natural disasters so powerful is their unpredictability. Volcanoes may give a few weeks’ at max. Hurricanes form and make landfall within a couple of days. We’ve vastly improved our tornado warning system; now we have nearly fifteen minutes of notice! And earthquakes- well, good luck. The 2005 hurricane season was especially unpredictable- we’ll get to that in a little bit. But the variability of hurricanes is what makes predicting the next powerful one especially difficult.

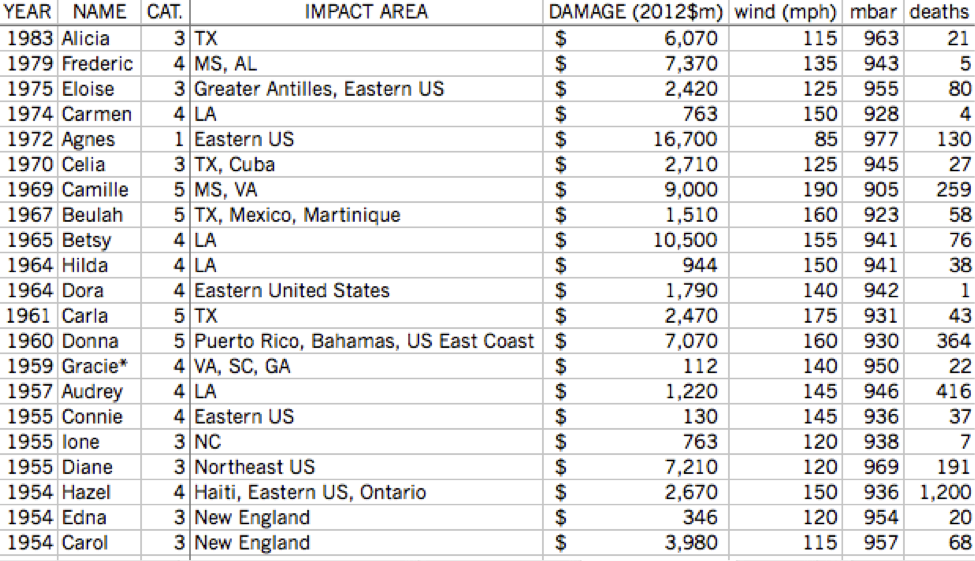
I could use all Atlantic hurricanes as my data set for this project, but I have neither the time nor the patience for that. Instead, I’m looking at only hurricanes who have been powerful enough to have their names retired:

There have been 77 retired names since 1954. One, Gracie (1959), is listed as retired by some sources but not others. Another, Allison (2001), was retired despite never actually becoming a hurricane.


There are a lot of extremely strong hurricanes in this set, but there’s still a very large number (there’s even a tropical storm!).  I’m going to narrow it down even further, to hurricanes that caused most of their damage to the United States. This eliminates hurricanes like Mitch in 1998, but I’m investigating when the next big hurricane will hit the U.S., not the rest of the Atlantic.


42 storms are represented above. I assigned a score to each hurricane based on each of the statistics on the right (scores not shown); Katrina (2005) was easily the most extreme hurricane ever to hit the United States.


Now we can begin looking for trends. Hurricanes overall appear to be getting stronger and it looks like there are more that have been retired in recent years, but…

R2 =0.07818


That’s not a very conclusive regression line, and logarithmic or exponential lines don’t really fit either. While the numbers from 2003-2005 are eye-catching (12 hurricane names retired in three years!), 2006 and 2009 did not have any hurricanes retired, and neither hurricane on that graph from 2010 made landfall in the U.S..

On the other hand, there has been a small increase in total named storms over the years:

http://upload.wikimedia.org/wikipedia/en/timeline/61b5be0856ccb449ab4978b2909ae8d7.png


There might be a bit of a cycle going on- in recent years, a two to four year cycle of powerful hurricane seasons appears. 2008 had several strong hurricanes three years after 2005, and 2009 had none after the weak 2006 season. But as we look back (and forward- just Irene in 2011), we can see that this theory doesn’t hold.

How about ENSO? We covered this phenomenon in depth a few months back, and it would make sense. El Nino supposedly represses hurricane growth, and our data supports that. Unusually strong El Nino effects match up with unusually weak hurricane season.  The reverse of El Nino, La Nina, would then spur hurricane growth, right? Not so fast- the data on hurricane seasons that correspond with La Nina doesn’t provide a strong correlation either way.

The key to this problem would appear to be the 2005 hurricane season. It was unusual in many ways. By all measures, it was the strongest hurricane season ever. Hurricane Emily was the earliest category 5 storm ever. Vince formed father northeast (into cooler waters) than any other storm on record. Wilma strengthened ridiculously fast after its formation. Hurricane Epsilon was the latest hurricanes ever, lasting deep into December. Tropical Storm Zeta went all the way into January. And yes; those are Greek letters, meaning that the 21 letters from the English alphabet were exhausted- the only time this has ever happened. In all, the 2005 season produced 31 tropical depressions, 27 named storms, and 15 hurricanes (7 of category 3 or above). It accounted for 3,913 deaths and over $150 billion of damage.

I can find just two unusual aspects concerning the climate in 2005. The first is that El Nino was expected to develop, but didn’t. The second is that the years leading up to it- 2002-2005- were four of the five warmest years on record (at the time). Fourteen hurricane names were retired for these four years, and the one other year in the top five was 1998, which saw the wraths of Hurricanes Mitch and Georges. Did the heat finally reach a climax in 2005, causing the extreme hurricane season? Maybe, but more likely not. In the Pacific, 2005 was an average or below average year. (It should be noted that 2006 was the most active Pacific season since 2000, however.) Additionally, many of the years since 2005 have been warmer, and yet none of them had hurricane seasons quite as strong.

Overall, I just can’t find a trend for powerful storm season. Hurricanes are simply so unpredictable that a storm season predicted to be “slightly above-average” can produce 28 named storms; the opposite can be true as well. We don’t know when, specifically, in a season the next big hurricane will hit, or even what year it will be.* We can make guesses, but nature will laugh at us and prove us wrong anyway. The best we can do is prepare for the worst and try to minimize the damage and loss of life.

*In 2011, Colorado State University, one of the leading hurricane prediction centers, announced that it would no longer be releasing quantitative forecasts six months prior to each season, as  "...forecasts of the last 20 years have not shown real-time forecast skill." Hurricanes are unpredictable even for the professionals from a long distance away.

Wednesday, August 29, 2012

Will There Ever Be A Time When No One Alive Has Walked On Another World?

The death of Neil Armstrong brought out a lot of emotions in me. I wasn't around when he took his first steps on the moon, but I was certainly aware of the magnitude of this achievement. To be able to look up to the moon and know that he and eleven others had walked there, on that sphere so far away, was captivating.

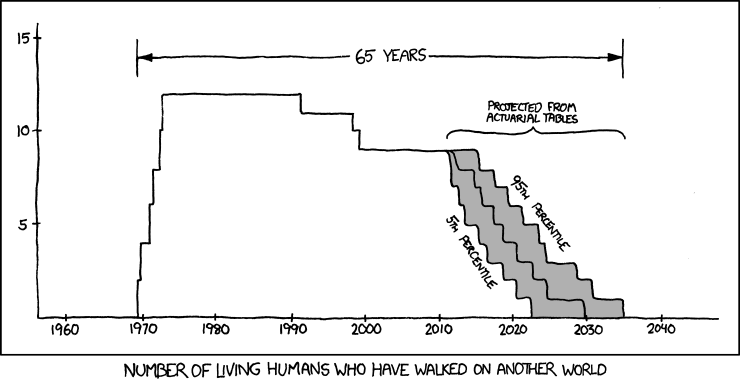
The death of the last frontiersman also instilled a thought in my head, though. No one has walked on the moon in nearly forty years. Some of you may remember this profound post made by Randall Munroe on xkcd:


With no plans in the near future to revisit the moon- and with Mars still a ways off- there may soon be a time when there will be no one alive who has walked on another planet or moon. It's a sad thing to think about.

When will that be, if it happens? I don't have the time to look up actuarial tables, so I used the average life expectancies for people with ages equal to the remaining astronauts (as can be found on Wolfram|Alpha). I took an extra liberty and assumed that, on average, each of them are within the top 10% of the population in terms of health (astronauts must be fit, and their habits likely continue into an older age). I did not do any research into their individual health conditions.

I also feel like getting someone on Mars is a matter of when, not if. NASA doesn't have any sort of formal timetable out on this project, but I've heard 2030 as a ballpark figure by multiple sources. My goal is to discover the odds of any of the astronauts surviving to 2030.

The results are promising on this front. By the time 2030 comes around three astronauts in particular- Eugene Cernan, Charles Duke, and Harrison Schmitt- will be younger than the lifespan for the top 10% of people their age. Taking all the astronauts together, the average chance that any one of them will survive until 2030 is about 7%. All things considered, I'd say the odds are good that someone will survive until we set foot on Mars. Anything past that 2030 date, however, and the odds go sharply down. All of the astronauts will be pushing 100 by then.

I don't feel great about looking at "death rates" because there's hardly anything statistical about it. It all depends on your lifestyle and past, and for these astronauts, I'm sure there's a long, bright future still ahead of them. I mean no disrespect to anyone, especially Neil Armstrong.

America needs a new frontiersman now, and I'm sure NASA is hard at work on it. You could say our Curiosity needs to be satisfied again. Let us move forward to Mars, while we look backwards with fond memories of our missions to the moon. RIP, Neil Armstrong.

My data:
https://docs.google.com/spreadsheet/ccc?key=0AnZrkjWWJajQdGlLMzFNWm1RUWFaZHJ5ZllRVkQ4c2c